| This post was kindly contributed by The SAS Dummy - go there to comment and to read the full post. |
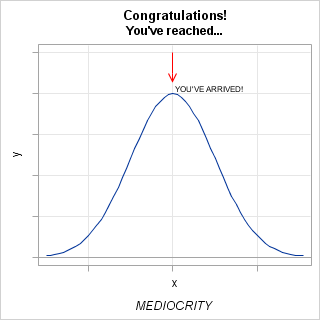
So many of us struggle with this mountain. In fact, 68.27% of us get within sight of reaching the summit (while 95.47% of us are at least on a perceivable slope). We run, walk, crawl and sometimes slide our way uphill (from one direction or the other) until we finally reach the top.
That is, the top of the “bell” curve.
I came across this t-shirt design over at shirt.woot.com, one of a number of entries that celebrate dubious honors. (Also worth a look: Least Noticed Person Ever and Duck, Duck, Goose Champion.)
The design inspired me. I thought, “I’m an average sort of SAS programmer; this is a summit that I can actually reach.” And with a middling amount of effort, I met my objective.
And you can do it too. But please, don’t knock yourself out. I sure-as-heck didn’t. In fact, I reached this dubious peak by climbing over the backs of others, lifting the code for generating a normal distribution from Rick, and the code for vector plots from the book by Sanjay and Dan.
Here’s my less-than-original SAS program that yields a less-than-original design:
ods graphics /width=500 height=500;

data normal;
  do x = -3 to 3 by 0.1;
    y = pdf("Normal", x);
    output;
  end;
  x0 = 0;
  y0 = .43;
  you="YOU'VE ARRIVED!";
  output;
run;

proc sgplot data=normal noautolegend;
  title "Congratulations!";
  title2 "You've reached...";
  footnote "MEDIOCRITY";
  series x=x y=y;
  vector x=x0 y=y0 /
    xorigin=x0 yorigin=.5
    arrowdirection=out
    lineattrs=(color=red thickness=1)
    datalabel=you;
  xaxis grid display=(novalues);
  yaxis grid display=(novalues);
  refline 0 / axis=y;
run;
| This post was kindly contributed by The SAS Dummy - go there to comment and to read the full post. |