| This post was kindly contributed by r4stats.com » SAS - go there to comment and to read the full post. |
I’m continuing to gather and analyze data to update The Popularity of Data Analysis Software. In this installment I cover the latest employment figures.
Employment is important to us all, so what software skills are employers seeking? A thorough answer to this question would require a time consuming content analysis of job descriptions. However, we can get a rough idea by searching on job advertising sites. Indeed.com is the most popular job search site in the world, so I used a program that went there weekly and searched jobs descriptions for keywords such as “SPSS” or “Minitab.” This was repeated during the 2nd, 3rd and 4th weeks of March in 2012 and 2013. (The data were meant to be for the complete two years, but the automated process went awry.)
The abbreviation “SAS” is common in computer storage, so I avoided those by searching for “SAS !SATA !storage !firmware” (the exclamation point represents a logical “not”). I focused on R while avoiding related topics like “R&D” by using “R SAS” or “SAS R”, including each package in the graph. The data for 2013 are presented in Figure 11.

- Figure 11. Mean number of jobs per week available on Indeed.com for each software (March 2013).
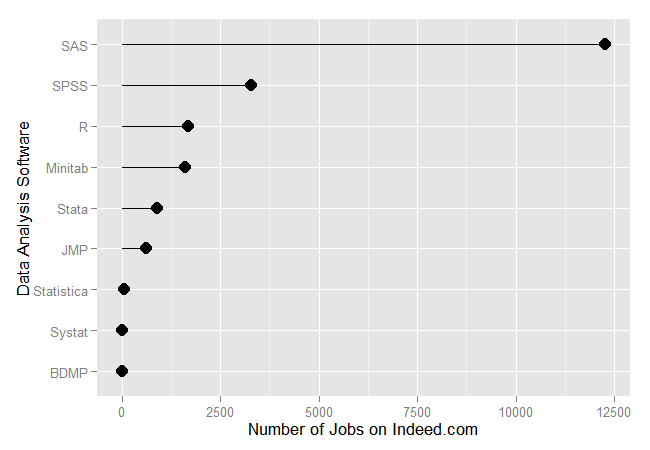
SAS has a very substantial lead in job openings, with SPSS coming in second with just over a quarter of the jobs. R comes in third place with slightly more than half the jobs available for SPSS. Compared to R or Minitab, SAS has over seven times as many jobs available!
Since 2012, job descriptions that included SAS declined by 961 (7.3%) and those containing Minitab declined by 154 (8.7%). Jobs for R increased by 497 (42%) pushing it past Minitab into third place by a slim margin. In fact, all packages except for SPSS and Systat showed significant though much smaller absolute changes (via Holm-corrected paired t-tests (Table 2). Since these comparisons are based on only three data points in each year, I would not put much stock in most of them, but the 48% increase for R is notable.
Given the extreme dominance of SAS, a data analyst would do well to know it unless he or she was seeking a job in a field in which one of the other packages is dominant.
                  2012      2013   Difference  Ratio
1        SAS     13234     12272      -961      0.93
2       SPSS      3299      3289       -10      1.00
3          R      1196      1693       497      1.42
4    Minitab      1769      1615      -154      0.91
5      Stata       842       898        56      1.07
6        JMP       644       619       -25      0.96
7 Statistica        61        71        10      1.17
8     Systat        14        15         1      1.07
9       BDMP         6        10         3      1.53
Table 2. Number of jobs on Indeed.com that list each software in March of 2012 and 2013. Changes are significant for all software except SPSS and Systat.

![]()
| This post was kindly contributed by r4stats.com » SAS - go there to comment and to read the full post. |