| This post was kindly contributed by r4stats.com » SAS - go there to comment and to read the full post. |
I’ve just updated the section below from The Popularity of Data Analysis Software. Note that the overall article is still under construction and all the figure numbers have changed from previous versions.
n
Growth in Capability
n
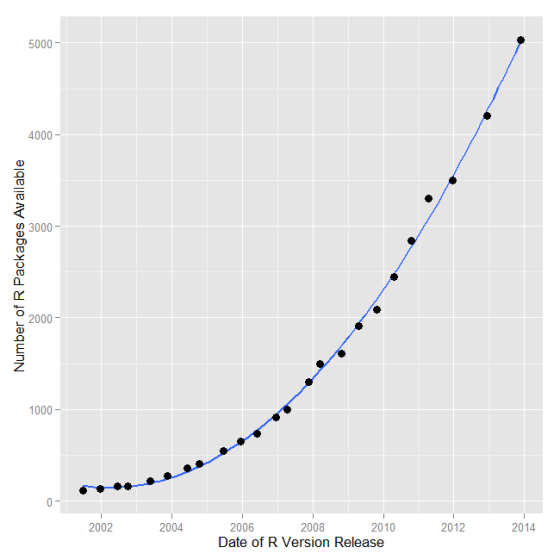
The capability of analytics software has grown significantly over the years. It would be helpful to be able to plot the growth of each software package’s capabilities, but such data is hard to obtain. John Fox (2009) acquired it for R’s main distribution site http://cran.r-project.org/. I collected the data for later versions following his method.
n
Figure 8 shows that the growth in R packages is following a rapid parabolic arc (quadratic fit with R-squared=.998). The right-most point is for version 3.0.2, the last version released in 2013.
n
- n
- n
n

n
n
n
As rapid as this growth has been, these data represent only the main CRAN repository. R does have eight other software repositories, such as the one at http://www.bioconductor.org/ that are not included in this graph. A program run on 4/7/2014 counted 7,364 R packages at all major repositories, 5,323 of which were at CRAN. So the growth curve for the software at all repositories would be roughly 38% higher on the y-axis than the one shown in Figure 8. As with any analysis software, individuals also maintain their own separate collections typically available on their web sites.
n
To put this astonishing growth in perspective, let us compare it to the most dominant commercial package, SAS. In version, 9.3, SAS contains around 1,200 commands that are roughly equivalent to R functions (procs, functions etc. in Base, Stat, ETS, HP Forecasting, Graph, IML, Macro, OR, QC). R packages contain a median of 5 functions (Rasmus Bååth, 12/2012 personal communication). Therefore R has approximately 36,820 functions compared to SAS’s 1,200. In fact, during 2013 alone, R added more functions/procs than SAS Institute has written in its entire history! That’s 835 packages, counting only CRAN, or around 4,175 functions. Of course these are not perfectly equivalent. Some SAS procedures have many more options to control their output than R functions do. However, R functions can nest inside one another, creating nearly infinite combinations. Also, SAS is now out with version 9.4 and I have not repeated the arduous task of recounting its commands. If SAS Institute would provide the figure, I would be happy to list it here. While the comparison is not perfect, it does provide an interesting perspective on the size and growth rate of R.

![]()
| This post was kindly contributed by r4stats.com » SAS - go there to comment and to read the full post. |