| This post was kindly contributed by SAS Users - go there to comment and to read the full post. |
Creating a map with SAS Visual Analytics begins with the geographic variable. The geographic variable is a special type of data variable where each item has a latitude and longitude value. For maximum flexibility, VA supports three types of geography variables:
- Predefined
- Custom coordinates
- Custom polygons
This is the first in a series of posts that will discuss each type of geography variable and their creation. The predefined geography variable is the easiest and quickest way to begin and will be the focus of this post.
SAS Visual Analytics comes with nine (9) predefined geographic lookup types. This lookup method requires that your data contains a variable matching one of these nine data types:
- Country or Region Names – Full proper name of a country or region (ISO 3166-1)
- Country or Region ISO 2-Letter Codes – Alpha-2 country code (ISO 3166-1)
- Country or Region ISO Numeric Codes – Numeric-3 country code (ISO 3166-1)
- Country or Region SAS Map ID Values – SAS ID values from MPASGFK continent data sets
- Subdivision (State, Province) Names – Full proper name for level 2 admin regions (ISO 3166-2)
- Subdivision (State, Province) SAS Map ID Values – SAS ID values from MAPSGFK continent data sets (Level 1)
- US State Names – Full proper name for US State
- US State Abbreviations – Two letter US State abbreviation
- US Zip Codes – A 5-digit US zip code (no regions)
Once you have identified a variable in your dataset matching one of these types, you are ready to begin. For our example map, the dataset ‘Crime’ and variable ‘State name’ will be used. Let’s get started.

Creating map with predefined geography variable
- Begin by opening VA and navigate to the Data panel on the left of the application.
- Select the desired dataset and locate a variable that matches one of the predefined lookup types discussed above. Click the down arrow to the right of the variable and select ‘Geography’ from the Classification dropdown menu.
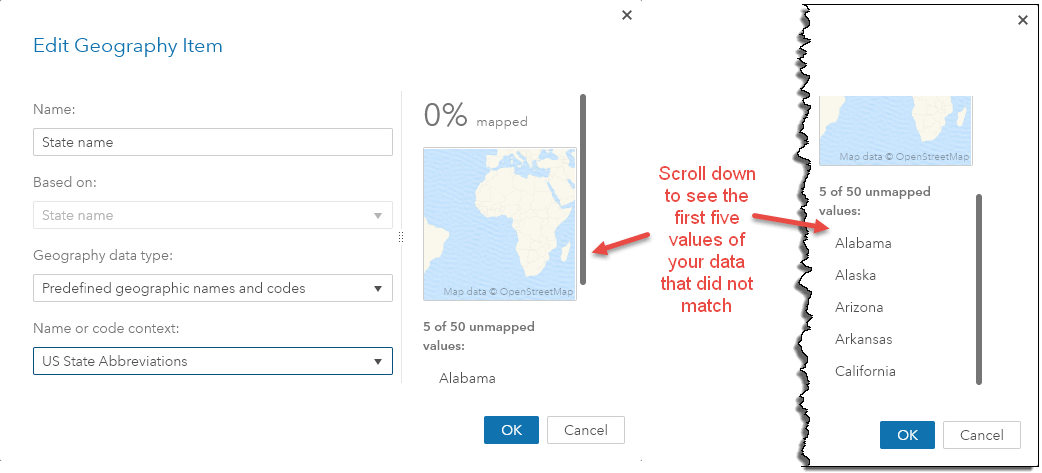
- The ‘Edit Geography Item’ window will open. Depending upon the type of geography variable selected, some of the options on this dialog will vary. The ‘Name’ textbox is common for all types and will contain the variable selected from your dataset. Edit this label as needed to make it more user friendly for your intended audience.
- The ‘Geography data type’ drop down list is where you select the desired type of geography variable. In this example, we are using the default predefined option.
- Locate the ‘Name or code context‘ dropdown list. Select the type of predefined variable that matches the data type of the variable chosen from your data. Once selected, VA scans your data and does an internal lookup on each data item. This process identifies latitude and longitude values for each item of your dataset. Lookup results are shown on the right of the window as a percentage and a thumbnail size map. The thumbnail map displays the the first 100 matches.
- If there are any unmatched data items, the first 5 will be displayed. This may provide a better understanding of your data. In this example, it is clear from variable name as to what type should be selected (US State Names). However, in most cases that choice will not be this obvious. The lesson here, know your data!
Unmatched data item indicators
Once you are satisfied with the matched results, click the OK button to continue. You should see a new section in the Data panel labeled ‘Geography’. The name of the variable will be displayed beside a globe icon. This icon represents the geography variable and provides confirmation it was created successfully.

Icon change for geography variable
Now that the geography variable has been created, we are ready to create a map. To do this, simply drag it from the Data panel and drop it on the VA report canvas. The auto-map feature of VA will recognize the geography variable and create a bubble map with an OpenStreetMap background. Congratulations! You have just created your first map in VA.

Default bubble map with OpenStreetmap background
The concept of a geography variable was introduced in this post as the foundation for creating all maps in VA. Using the predefined geography variable is the quickest way to get started with Geo maps. In situations when the predefined type is not possible, using one of VA’s custom geography types becomes necessary. These scenarios will be discussed in future blog posts.
Note: The concept and method described for creating a predefined geographic lookup variable applies to all versions of SAS Visual Analytics. Screenshots in this post were taken from VA 8.3.1 and may differ slightly from your version of VA.
Fundamentals of SAS Visual Analytics geo maps was published on SAS Users.
| This post was kindly contributed by SAS Users - go there to comment and to read the full post. |