| This post was kindly contributed by SAS Users - go there to comment and to read the full post. |
SAS Visual Analytics supports region maps for Country, US states, and provinces out-of-the-box. These work well for small scale maps covering the world, a continent, or a single country. However, other regions are often needed. Beginning in version 8.3, VA supports custom polygons to display regions such as sales territories, counties, or zip codes.
Region (choropleth) maps use a fill color to show relationships between the regions based upon a response value from your data. Using custom polygons in VA follows the same steps outlined in previous posts for predefined or custom coordinate geography items, with just a few additional steps. Here’s the basic flow:
- Identify your data
- Import polygon shapefile into SAS dataset
- Import the shape dataset into VA
- Create a Custom polygon provider
- Create the geography item
- Create and customize the map
Before we begin
VA supports two sources for creating custom polygons: Esri shapefiles and Esri Feature Services. The goal for this post is to show how to create custom polygons using an Esri shapefile.
Typically, when working with custom polygons, you will have two datasets: the first defines the custom regions (shape data) and the second contains the data you wish to map (business data). The shape data is derived from an Esri shapefile or feature service. The business data can be in a shapefile or any format supported by VA (.sas7bdat, .csv, .xls, etc). It contains the information you want to analyze distributed across the regions defined by the shape data.
It is recommended that you verify the imported shape data before using it in your final map. This will confirm the data is valid and make debugging an issue easier should you encounter any errors. To verify, use the same dataset for both the shape and business data. The example below will use this approach.
Access to a GIS application such as Esri’s ArcGIS or QGIS is recommended. There are two areas where they can help you prepare to use custom polygons in your VA map:
- Creating a shapefile to define polygons specific to your business need or application
- Viewing the attribute table of existing shapefiles to determine its unique identifier column
For this example, we will be creating a map of registered Neighborhood Associations in Boise, Idaho. To follow along, download the data from the City of Boise open data site: Boise Neighborhood Associations
1. Identify your data
Shape data
The shape data defining the custom regions needs to be in an Esri shapefile format. These files can be created in a GIS application or obtained from a wide variety of online sources such as: the US Census Bureau (http://www.census.gov); local and state municipalities; state agencies such as the Department of Transportation; and university GIS departments. Most municipalities now have Open Data portals that provide a wealth of reliable data for public use. These sources are maintained by dedicated staff and are updated regularly.
Business data
The business data can be specific to your company’s operation or customer base. Or it can be broad and general using census or demographic information. It answers the question of What you want to analyze on the map. The business data must contain a column that aligns with your shape data. For example: If you want to map the age distribution and spending habits of your target customers across zip codes, then your business data must have a column for zip codes that allows it to be joined to a zip code region in the shape data.
2. Import polygon data into a SAS dataset
VA 8.3 does not support the native shapefile format. To use a shapefile in VA, you must first import it into SAS. Included with Viya3.4, the %shpimprt macro will convert a shapefile into a SAS dataset and load it into CAS. You can find the documentation for it here: %shpimprt documentation.
Alternatively, the shapefile can be manually imported with these basic steps:
- Import the shapefile into SAS
- Add a sequence column to the dataset
- Reduce the density of the dataset
- Limit the dataset based on the density value
Additional details and sample code for each of these steps can be found in the text file linked here: Manual shapefile import steps.
3. Import the shape dataset into VA
Next, we must import the dataset into VA, if using the manual shapefile import process. To do this, locate the data pane on the left of VA. From the ‘Open Data Source’ window, select Import > Local File. Navigate to the location of the SAS dataset created from Step 2 and click the Open button.
Adjust the target location as needed, based on your VA installation, and make note of the location selected. This path will be required to configure the custom polygon provider. Review and adjust the other options as needed. Click the blue ‘Import Item’ button at the top of the window to start the import process. A message will appear indicating the import status. Upon successful import, click the ‘OK’ button to open the dataset.

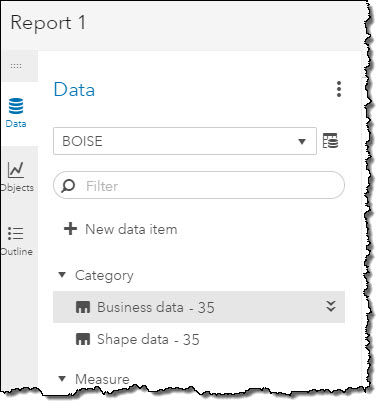
Since we are using the same dataset for the shape and business data, we need to make a copy of the category variable that will be used for our map. Right click on ‘ASSOCIATIO’ and select ‘Duplicate’. Next, let’s change the names of both variables to better distinguish them from one another:
- Change ‘ASSOCIATIO’ to ‘Business data’
- Change ‘ASSOCIATIO (1)’ to ‘Shape data’
4. Create the geography item
We are now ready to start creating the geography item. With Custom polygons, an additional step is required beyond what was described in previous posts with predefined and custom coordinates geography items. We must define a Custom Polygon provider so VA knows how to locate and display the Boise Neighborhood Associations. This is needed only once and is part of the geography item setup you are familiar with.
Our goal is to map the regions of the Boise Neighborhood Associations, so we will use ‘Shape data’ for our geography item. Locate it in the VA data panel and change its Classification type to ‘Geography’. From the ‘Geography data type’ dropdown, select ‘Custom polygonal shapes’. Several new fields will be displayed. In the ‘Custom polygon provider’ dropdown, click the ‘Define new polygon provider’ button.
A ‘New Polygon Provider’ window will appear. All fields shown are required. The Advanced section has additional options, but they are not needed for this example.
Configure the fields based on the following:
- Name / Label – Enter ‘Boise Neighborhoods’ for both (these values do not have to be the same)
- Type – The default CAS Table is the correct option for this example.
- Server / Library – These values must match those used for the data upload in Step 3.
- Table – Select the name of the table uploaded in Step 3 (Boise_Neighborhoods)
- ID Column – The unique identifier column of the dataset. Used to join the shape and business data together. (Select OBJECTID)
- Sequence Column – This column is created during the import process from Step 2. Needed by VA to display the custom regions. (Select SEQUENCE)

The custom polygon provider is now configured. All that is needed to finish the geography item setup, is to identify the Region ID. This is the crucial step that will join the shape data to the business data. The Region ID column must match the ID Column chosen when the custom polygon provider was setup. Since we are using the same dataset in this example, that value is the same: OBJECTID.
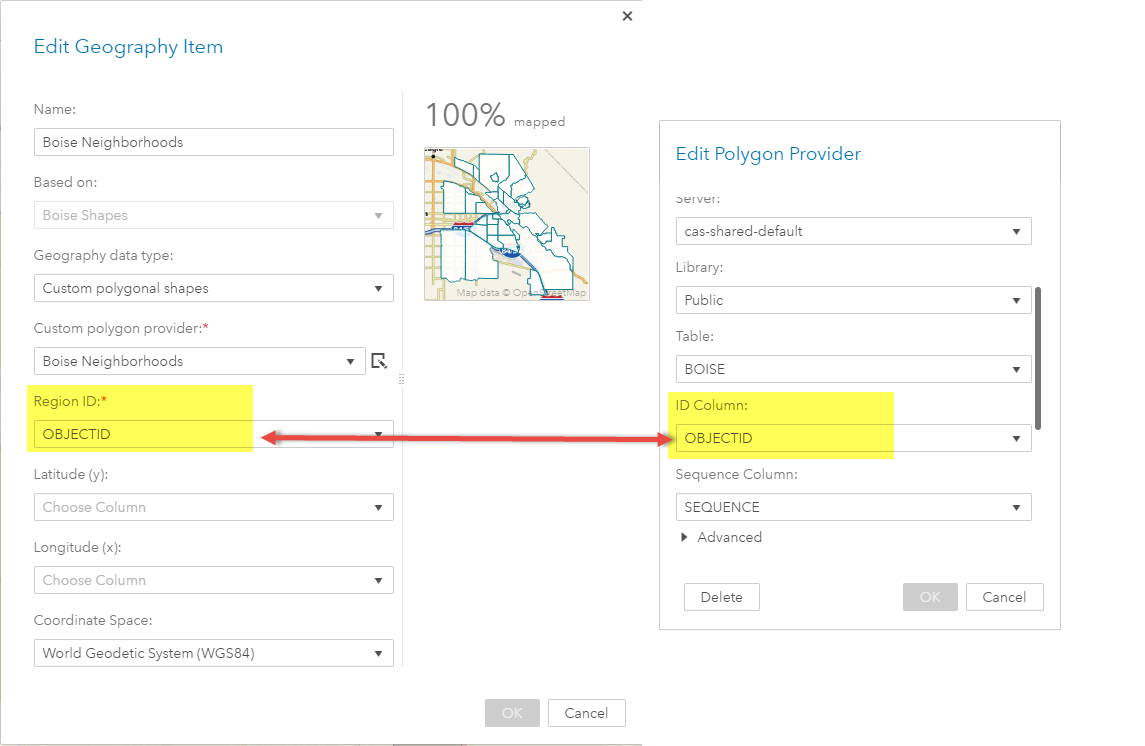
In cases where different datasets are used for the shape and business data, the name of Region ID and ID Column may be different. The column labels are not important, but their content must match for the join to occur.
Notice that once you select the correct RegionID value, the preview window will display the custom regions from the imported shape data. The Latitude and Longitude columns are not required in this example. Click the ‘OK’ button, to finish the setup.
5. Create and customize the map
You are now ready to create your map. Drag the Boise Neighborhoods geography item to the report canvas. Let’s enhance the appearance of our map by making a few style changes:
- Set a Color role to shade the Neighborhood Association regions (Roles > Color > Business data)
- Position the legend on the left of the map (Options > Legend)
- Adjust the transparency of the fill color to 45% (Options > Map Transparency)
- Change the map service to Esri World Street Map (Options > Map service)

Final map with custom polygons.
Congratulations! You have just created your first custom region map. In this post we discussed how to use the Custom Polygon provider to define your own regions using an Esri shapefile. Compared to the Predefined and Custom Coordinate options, custom polygons give you additional flexibility and control over how your spatial data is analyzed.
Creating custom region maps with SAS Visual Analytics was published on SAS Users.
| This post was kindly contributed by SAS Users - go there to comment and to read the full post. |