| This post was kindly contributed by SAS Users - go there to comment and to read the full post. |
Welcome to the sixth installment in my series Getting Started with Python Integration to SAS Viya. In previous posts, I discussed how to connect to the CAS server, how to execute CAS actions, and how to work with the results. Now it’s time to generate simple descriptive statistics of a CAS table.
Let’s begin by confirming the cars table is loaded into memory. With a connection to CAS established, execute the tableInfo action to view available in-memory tables. If necessary, you can execute the following code in SAS Studio to load the sashelp.cars table into memory.
conn.tableinfo(caslib="casuser") |

The results show the cars table is loaded into memory and available for processing. Next, reference the cars table in the variable tbl. Then use the print function to show the value of the variable.
tbl = conn.CASTable('cars', caslib='casuser') print(tbl) CASTable('cars', caslib='casuser') |
The results show that the tbl variable references the cars table in the CAS server.
Preview the CAS Table
First things first. Remember, the SWAT package blends the world of Pandas and CAS into one. So you can begin with the traditional head method to preview the CAS table.
tbl.head() |
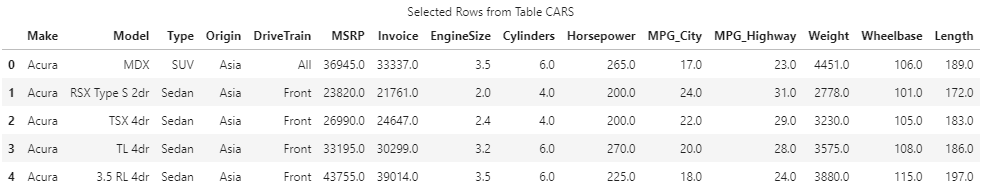
The SWAT head method returns five rows from the CAS server to the client as expected.
The Describe Method
Next, let’s retrieve descriptive statistics of all numeric columns by using the familiar describe method on the CAS table.
tbl.describe() |

The SWAT describe method returns the same descriptive statistics as the Pandas describe method. The only difference is that the SWAT version uses the CAS API to convert the describe method into CAS actions behind the scenes to process the data on the distributed CAS server. CAS processes the data and returns summarized results back to the client as a SASDataFrame, which is a subclass of the Pandas DataFrame. You can now work with the results as you would a Pandas DataFrame.
Summary CAS Action
Instead of using the familiar describe method, let’s use a CAS action to do something similar. Here I’ll use the summary CAS action.
tbl.summary() |

The results of the summary action return a CASResults object (Python dictionary) to the client. The CASResults object contains a single key named Summary with a SASDataFrame as the value. The SASDataFrame shows a variety of descriptive statistics. While the summary action does not return exactly the same statistics as the describe method, it can provide additional insights into your data.
What if we don’t want all the statistics for all of the data?
Selecting Columns and Summary Statistics with the Summary Action
Let’s add additional parameters to the summary action. I’ll add the inputs parameter to specify the columns to analyze in the CAS server.
tbl.summary(inputs = ['MPG_City','MPG_Highway']) |

The results show only the MPG_City and MPG_Highway columns were analyzed.
Next, I’ll use the subSet parameter to specify the summary statistics to produce. Here I’ll obtain the MEAN, MIN and MAX.
tbl.summary(inputs = ['MPG_City','MPG_Highway'], subSet = ['mean','min','max']) |

The results processed only the MPG_City and MPG_Highway columns, and returned only the specified summary statistics to the client.
Creating a Calculated Column
Lastly, let’s create a calculated column within the summary action. There are a variety of ways to do this. I like to add it as a parameter to the CASTable object. You can do that by specifying the tbl object, then computedVarsProgram parameter. Within computedVarsProgram you can use SAS assignment statements with most SAS functions. Here we will create a new column name MPG_Avg that takes the mean of MPG_City and MPG_Highway. Lastly, add the new column to the inputs parameter.
tbl.computedVarsProgram = 'MPG_Avg = mean(MPG_City, MPG_Highway);' tbl.summary(inputs = ['MPG_City','MPG_Highway', 'MPG_Avg'], subSet = ['mean','min','max']) |
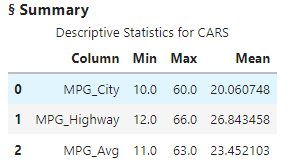
In the results I see the calculated column and requested summary statistics.
Summary
The SWAT package blends the world of Pandas and CAS. You can use many of the familiar Pandas methods within the SWAT package, or the flexible, highly optimized CAS actions like summary to easily obtain summary statistics of your data in the massively parallel processing CAS engine.
Additional and related resources
Getting Started with Python Integration to SAS® Viya® – Index
SWAT API Reference
CAS Action Documentation
SAS® Cloud Analytic Services: Fundamentals
SAS Scripting Wrapper for Analytics Transfer (SWAT)
CAS Action! – a series on fundamentals
Execute the following code in SAS Studio to load the sashelp.cars table into memory
Getting Started with Python Integration to SAS® Viya® – Part 6 – Descriptive Statistics was published on SAS Users.
| This post was kindly contributed by SAS Users - go there to comment and to read the full post. |