When good graphs go bad…. In case you need a justification for all the turkey you ate on Thanksgiving, this article from Economist magazine explains all while providing a great example of the use and abuse of statistics, in particular why extrapolation is risky business. And to those who may have consumed more turkey than […]![]()
Category: SAS
Updated: Why R is Hard to Learn
I’ve updated one of my most widely read blog posts, Why R is Hard to Learn. It focuses on the aspects of R which tend to trip up beginners. The new version is over twice as long as the original … Continue reading →![]()
Top 17 SAS Interview questions
Click Here
Spark practice (1): find the stranger that shares the most friends with me
Given the friend pairs in the sample text below (each line contains two people who are friends), find the stranger that shares the most friends with me.sample.txtme Alice
Henry me
Henry Alice
me Jane
Alice John
Jane John
Judy Alice
me Mary
Mary Joyce
Joyce Henry
Judy me
Judy Jane
John Carol
Carol me
Mary Henry
Louise Ronald
Ronald Thomas
William Thomas
Thoughts
The scenario is commonly seen for a social network user. Spark has three methods to query such data:
- MapReduce
- GraphX
- Spark SQL
If I start with the simplest MapReduce approach, then I would like to use two hash tables in Python. First I scan all friend pairs and store the friends for each person in a hash table. Second I use another hash table to count my friends’ friends and pick out the strangers to me.
Single machine solution
#!/usr/bin/env python
# coding=utf-8
htable1 = {}
with open('sample.txt', 'rb') as infile:
for l in infile:
        line = l.split()
if line[0] not in htable1:
            htable1[line[0]] = [line[1]]
else:
            htable1[line[0]] += [line[1]]
if line[1] not in htable1:
            htable1[line[1]] = [line[0]]
else:
            htable1[line[1]] += [line[0]]

lst = htable1['me']
htable2 = {}
for key, value in htable1.iteritems():
if key in lst:
for x in value:
if x not in lst and x != 'me': # should only limit to strangers
if x not in htable2:
                    htable2[x] = 1
else:
                    htable2[x] += 1

for x in sorted(htable2, key = htable2.get, reverse = True):
print "The stranger {} has {} common friends with me".format(x,
        htable2[x])
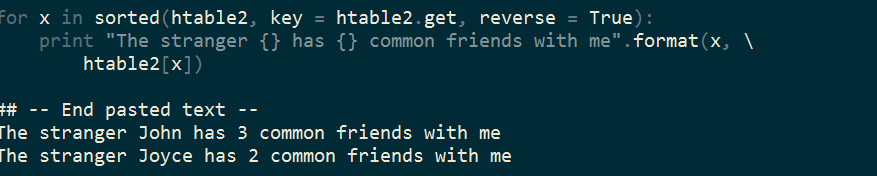
The result shows that John has three common friends like I do, followed by Joyce who has two. Therefore, John will be the one who is most likely to be recommended by the social network.
Cluster solution
If the log file for the friend pairs is quite big, say, like several GB size, the single machine solution is not able to load the data into the memory and we have to seek help from a cluster.
Spark provides the
pair RDD that is similar to a hash table and essentially a key-value structure. To translate the single machine solution to a cluster one, I use the operators from Spark’s Python API including map, reduceByKey, filter, union and sortByKey. #!/usr/bin/env python
# coding=utf-8
import pyspark
sc = pyspark.SparkContext()
# Load data from hdfs
rdd = sc.textFile('hdfs://sample.txt')
# Build the first pair RDD
rdd1 = rdd.map(lambda x: x.split()).union(rdd.map(lambda x: x.split()[::-1]))
# Bring my friend list to local
lst = rdd1.filter(lambda x: x[0] == 'me').map(lambda x: x[1]).collect()
# Build the second pari RDD
rdd2 = rdd1.filter(lambda x: x[0] in lst).map(lambda x: x[1])
.filter(lambda x: x != 'me' and x not in lst)
.map(lambda x: (x, 1)).reduceByKey(lambda a, b: a + b)
.map(lambda (x, y): (y, x)).sortByKey(ascending = False)
# Save the result to hdfs
rdd2.saveAsTextFile("hdfs://sample_output")
# Bring the result to local since the sample is small
for x, y in rdd2.collect():
print "The stranger {} has {} common friends with me".format(y, x)
sc.stop()
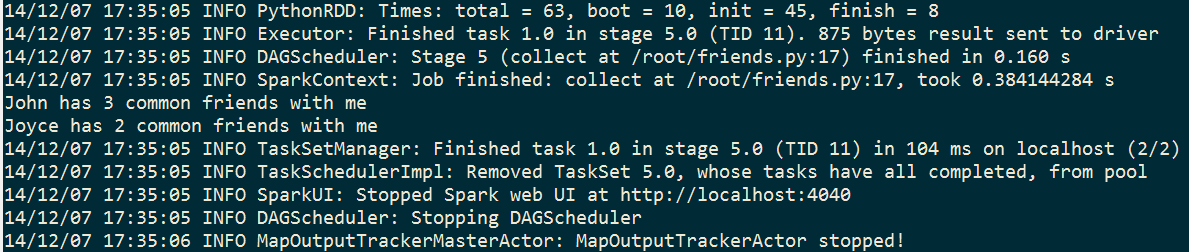
The result is the same. In this experiment, most time is spent on the data loading process from HDFS to the memory. The following MapReduce operations actually costs just a small fraction of overall time. In conclusion, Spark fits well on an iterative data analysis against existing RDD.
Use a vector to print Pascal’s triangle in SAS
Yesterday Rick Wicklin showed a cool SAS/IML function to use a matrix and print a Pascal’s triangle. I come up with an alternative solution by using a vector in SAS/IML.
Method
Two functions are used, including a main function
PascalRule and a helper function _PascalRule. The helper function recycles the vector every time and fills the updated values; the main function increases the length of the vector from 1 to n.Pro
Get the nth row directly, for example, return the 10th row by
PascalRule(10); no need to use a matrix or matrix related operators; use less memory to fit a possibly bigger n.Con
More lines of codes; slowlier to print the triangle, since there is no data structure such as matrix to remember the transient numbers.
proc iml;
/* The main function */
start PascalRule(n);
if n <= 1 then
return({1});
        answer = {1, 1};
        do i = 1 to n - 2 ;
            answer = _PascalRule(answer);
        end;
return(answer);
    finish;
/* The helper function */
start _PascalRule(vector);
        previous = 1;
        do i = 2 to nrow(vector);
            current = vector[i];
            vector[i] = previous + current;
            previous = current;
        end;
        vector = vector // {1};
return(vector);
    finish;
/* Print the pascal's triangle */
    do i = 1 to 10;
        x = PascalRule(i);
        x = x`;
        print x;
    end;
quit;
Theoretically, Rick’s solution has a time complexity of
O(N^2) and a space complexity of O(N^2), while my solution has a time complexity of O(N^3) (unfortunately have to use three times of do loop in IML) and a space complexity of O(N). Actually it’s a trade-off between speed and memory cost.
Fibonacci sequence in R and SAS
Because the Fibonacci sequence is simply defined by recursion, it makes for an elegant programming exercise. Here is one way to do it in SAS, and another way to do it in R. I’ve also included unit testing code to check that it works.
Fibonacci sequence in SAS using a recursive macro:
%macro fib(n);
%if &n = 1 %then 1; * first seed value;
%else %if &n = 2 %then 1; * second seed value;
%else %eval(%fib(%eval(&n-1))+%fib(%eval(&n-2))); * use recursion;
%mend;

* show values 1-5;
%put %fib(1);
%put %fib(2);
%put %fib(3);
%put %fib(4);
%put %fib(5);

* check values 1-10;
%macro check_fib;
%if %fib(1) ne 1 %then %abort;
%if %fib(2) ne 1 %then %abort;
%if %fib(3) ne 2 %then %abort;
%if %fib(4) ne 3 %then %abort;
%if %fib(5) ne 5 %then %abort;
%if %fib(6) ne 8 %then %abort;
%if %fib(7) ne 13 %then %abort;
%if %fib(8) ne 21 %then %abort;
%if %fib(9) ne 34 %then %abort;
%if %fib(10) ne 55 %then %abort;
%put NOTE: OK!;
%mend;
%check_fib;
Fibonacci sequence in R using a recursive function that supports either single integers or a vector of integers:
fib  {
    if (length(n) > 1) return(sapply(n, fib)) # accept a numeric vector
    if (n == 1) return(1) # first seed value
    if (n == 2) return(1) # second seed value
    return(fib(n-1)+fib(n-2)) # use recursion
}

# print first five Fibonacci numbers
fib(1)
fib(2)
fib(3)
fib(4)
fib(5)

# verify the Fibonacci sequence 1 through 10
(actual (expected all.equal(actual,expected)
For alternative implements, see SAS and R: Example 7.1: Create a Fibonacci sequence. In SAS, Nick Horton calculates the Fibonacci sequence using a DATA STEP, and in R he uses a FOR loop.
Adam Rich responded with his post Fibonacci Sequence in R with Memoization which gives a performance boost by caching the results.
In the comments below, Rick Wicklin referred to his SAS/IML solution that generates the Fibonacci sequence iteratively and Matrices, eigenvalues, Fibonacci, and the golden ratio.
This post first appeared on Heuristic Andrew.
For more posts like this, see Heuristic Andrew.
Using SAS Enterprise Guide with your local SAS installation
If you have SAS Enterprise Guide and SAS for Windows installed on a machine together, they should Just Work. There is no special setup required. But…what if they don’t? I’ve posted an article in the SAS Enterprise Guide community about this topic. Read the article to learn: How to select […]
The post Using SAS Enterprise Guide with your local SAS installation appeared first on The SAS Dummy.
RStudio in the cloud for dummies, 2014/2015 edition
In 2012, we presented a post showing how to run RStudio in the cloud on an Amazon server. There were 7 steps, including one with 7 sub-steps, one of which had 6 sub-sub-steps. It was still pretty easy, for what it was– an effectively free computer i…