Multicollinearity and its consequences
Multicollinearity usually brings significant challenges to a regression model by using either normal equation or gradient descent.
1. Invertible SSCP for normal equation
According to normal equation, the coefficients could be obtained by
%5E%7B-1%7DX'y)
. If the SSCP turns to be singular and non-invertible due to multicollinearity, then the coefficients are theoretically not solvable.
2. Unstable solution for gradient descent
The gradient descent algorithm seeks to use iterative methods to minimize residual sum of squares (RSS). For example, as the plot above shows, if there is strong relationship between two regressors in a regression, many possible combinations of

and

lie along a narrow valley, which all corresponds to the minimal RSS. Thus
can be negative, positive or even zero, which becomes a confounding effect with respect to a stable model.
Partial Least Squares v.s. Principle Components Regression
The most direct way to deal with multicollinearity is to break down the regressors and construct new orthogonal variables. PLS and PCR are both dimension reduction methods that eliminate multicollinearity. The difference is that PLS also implements the response variable to select the new components. PLS is particularly useful in answering questions with multiple response variables.
The PLS procedure in SAS is a powerful and flexible tool applying either PLS or PCR. One book,
An Introduction to StatisticalLearning, suggests PCR over PLS.
While the supervised dimension reduction of PLS can reduce bias, it also has the potential to increase variance, so that the overall benefit of PLS relative to PCR is a wash.
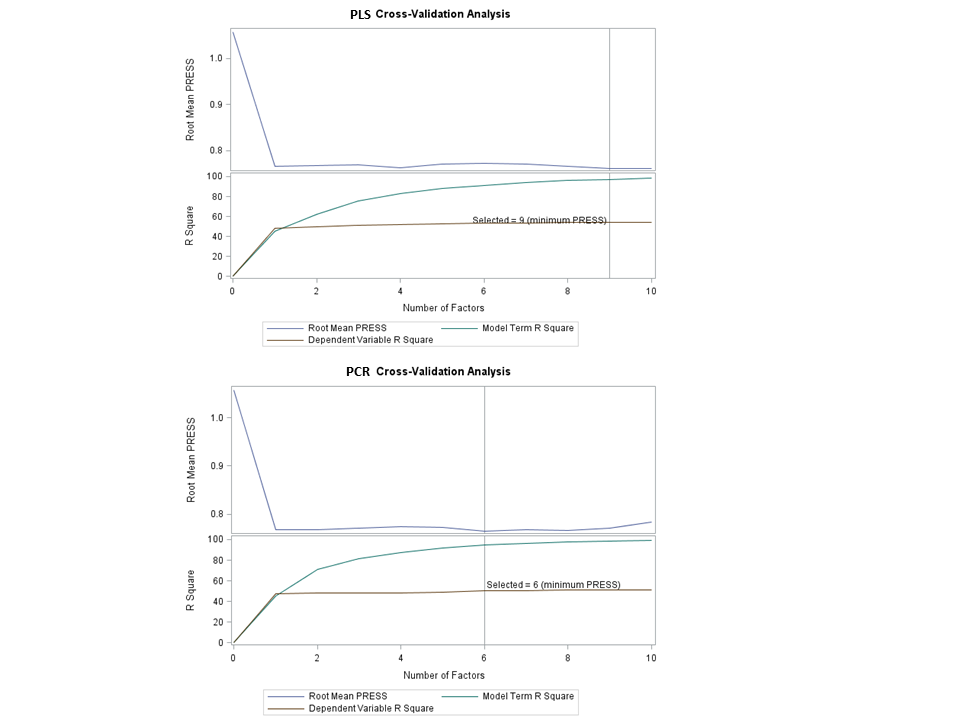
In the example using the baseball data set below, with 10-fold cross-validation, PLS chooses 9 components, while PCR picks out 5.
filename myfile url 'https://svn.r-project.org/ESS/trunk/fontlock-test/baseball.sas';
%include myfile;
proc contents data=baseball   position;
   ods output position = pos;
run;

proc sql;
   select variable into: regressors separated by ' '
   from pos
   where num between 5 and 20;
quit;
%put ®ressors;

data baseball_t;
   set baseball;
      logsalary = log10(salary);
run;

proc pls data=baseball_t censcale nfac=10 cv=split(10);
   title 'partial least squares';
   model logsalary=®ressors;
run;

proc pls data=baseball_t censcale method = pcr nfac=10 cv=split(10);
   title 'princinple components regression';
   model logsalary=®ressors;
run;

Read more →