| This post was kindly contributed by Avocet Solutions - go there to comment and to read the full post. |
 ODS Graphics is not exactly new. It became production with SAS 9.2 back around 2008, and before then it existed in a pre-production form at least as early as 2003. So you would think that by now everyone who uses SAS would be using ODS Graphics, but apparently this is not the case.
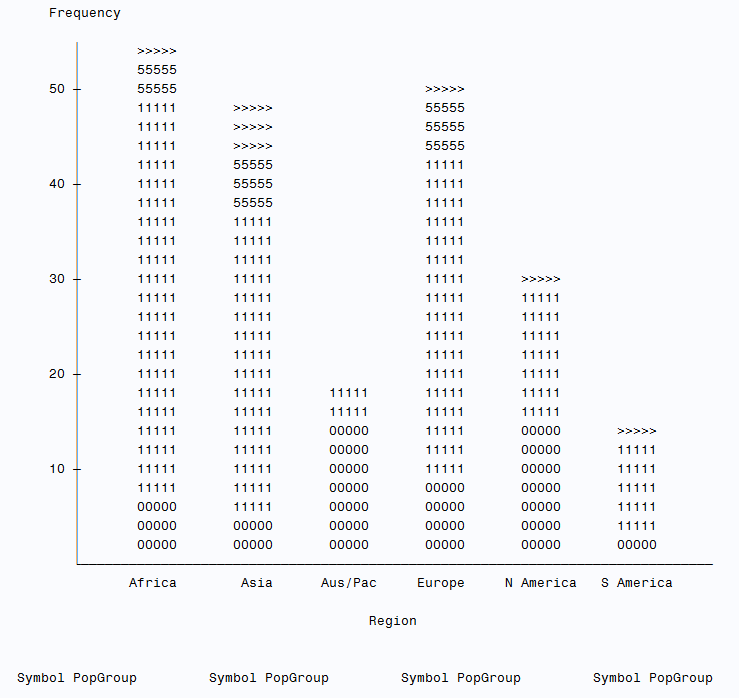
It has come to my attention that some long-time SAS users still use PROC CHART–not even PROC GCHART, but PROC CHART which was designed for line printers back in the 1970s and creates graphs using alphanumeric characters! Here is an example of a bar chart created using PROC CHART:
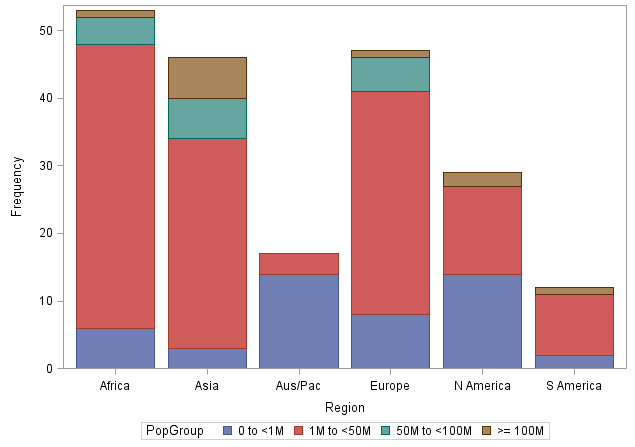
There is no excuse for this (unless, of course, you are trying to create a hip, retro vibe). ODS Graphics is easy to use and produces beautiful graphs. Here is the same bar chart created using PROC SGPLOT:
Now, if you are one of those people who uses SAS/Graph and PROC GCHART, and you are able to get the results you want, then that’s great. I would never tell a SAS/Graph user to switch to ODS Graphics. But for most people SAS/Graph is just too hard to use. That’s why the developers at SAS created ODS Graphics: for the rest of us. Just to prove that PROC SGPLOT is not any harder than PROC CHART, here is the code I used to create the two preceding bar charts:
PROC CHART DATA = olympics;
VBAR Region / SUBGROUP = PopGroup;
RUN;
PROC SGPLOT DATA = olympics;
VBAR Region / GROUP = PopGroup;
RUN;
If you are one of those people who still hasn’t learned ODS Graphics (or if you are new to SAS and want to get off on the right foot), this is your big chance. At the recent SAS Global Forum conference, Lora Delwiche and I presented our paper “Graphing Made Easy with SGPLOT and SGPANEL Procedures.” You can view that presentation. Give us 50 minutes of your time, and we will convince you that ODS Graphics is easy (and maybe even fun) to use. We start with a general introduction so you understand how the SGPLOT and SGPANEL procedures fit into the larger world of ODS Graphics, then we show how to create different types of graphs and how to customize them.
To watch our presentation, click here.
To download a copy of our paper, click here.
A lot of other great presentations were recorded at SGF too. To see the full list, click here.
Happy graphing!

![]()
| This post was kindly contributed by Avocet Solutions - go there to comment and to read the full post. |