| This post was kindly contributed by SAS Users - go there to comment and to read the full post. |
Welcome to the continuation of my series Getting Started with Python Integration to SAS Viya. In previous posts, I discussed how to connect to the CAS server, working with CAS actions and CASResults objects, and how to summarize columns. Now it’s time to focus on how to get the count of unique values in a CAS table column.
Load and prepare data
First, I connected my Python client to the distributed CAS server and named my connection conn. Then I created a function to load and prepare my CAS table. The custom function loads the WARRANTY_CLAIMS_0117.sashdat file from the Samples caslib into memory, renames the columns using the column labels and drops unnecessary columns. This simplifies the table for the demonstration.
The Samples caslib should be available in your SAS Viya environment and contains sample tables. For more information on how to rename columns in a CAS table view Part 11 – Rename Columns.
## Packages import swat import pandas as pd ## Options pd.set_option('display.max_columns', 50) ## Connect to CAS conn = ## your connection information def prep_data(): ## Load the data into CAS conn.loadTable(path='WARRANTY_CLAIMS_0117.sashdat', caslib='samples', casout={'name':'warranty_claims', 'caslib':'casuser'}) ## Reference the CAS table in an object castbl = conn.CASTable('warranty_claims', caslib = 'casuser') ## Store the column names and labels in a dataframe df_col_names = castbl.columnInfo()['ColumnInfo'].loc[:,['Column','Label']] ## Create a list of dictionaries of how to rename each column using the column labels renameColumns = [] for row in df_col_names.iterrows(): colName = row[1].values[0] labelName = row[1].values[1].replace(' ','_') renameColumns.append(dict(name=colName, rename=labelName)) ## List of columns to keep in the CAS table keepColumns = {'Campaign_Type', 'Platform','Trim_Level','Make','Model_Year','Engine_Model', 'Vehicle_Assembly_Plant','Claim_Repair_Start_Date', 'Claim_Repair_End_Date'} ## Rename and drop columns to make the table easier to use castbl.alterTable(columns = renameColumns, keep = keepColumns) return castbl |
Next, I’ll execute the user defined function and store the CAS table object in the variable tbl and view it’s type.
tbl = prep_data() type(tbl) # and the results NOTE: Cloud Analytic Services made the file WARRANTY_CLAIMS_0117.sashdat available as table WARRANTY_CLAIMS in caslib CASUSER(Peter). swat.cas.table.CASTable |
The results show that the WARRANTY_CLAIMS_0117.sashdat is available in the CAS server, and tbl is a CASTable object.
Lastly, I’ll preview the distributed CAS table using the SWAT package head method.
tbl.head() |

The results show a preview of the WARRANTY_CLAIMS CAS table. The table provides data on warranty claims for car repairs. The data in this example is small for training purposes. Processing data in the CAS server’s massively parallel processing environment is typically reserved for larger data.
Using the Pandas API in the SWAT package – value_counts method
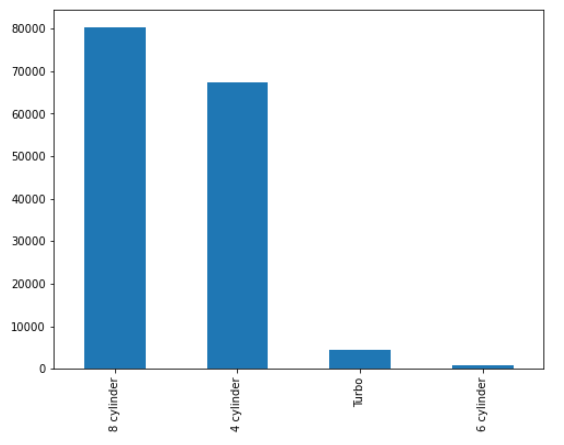
I’ll begin by using the Pandas API in the SWAT package which provides the value_counts method. The value_counts method works like it’s Pandas counterpart. For example, I’ll obtain the count of unique values in the Engine_Model CAS table column. I’ll store the results of in vc, then display the type and value of vc.
vc = (tbl ## CAS table .Engine_Model ## CAS table column .value_counts() ## SWAT value_counts method ) ## Display the type and value display(type(vc),vc) |

The SWAT value_counts method summarizes the data in the distributed CAS server and returns a Pandas Series to the Python client. Once you have the Pandas Series on the client, you can work with it as you normally would. For example, I’ll plot the Series using the Pandas plot method.
vc.plot(kind = 'bar', figsize=(8,6)); |
In this example, I used the Pandas API in the SWAT package to summarize data on the CAS server’s massively parallel processing environment to return smaller, summarized results to the Python client. Once the summarized results are on the client, I’ll work with them using other Python packages like Pandas.
Using the freq CAS action
Instead of using the Pandas API in the SWAT package you can achieve similar results using native CAS actions. In SWAT, CAS actions are simply specified as a method. One action that provides the count of unique values is the simple.freq CAS action.
For example, I can find the count of unique values for multiple columns within the freq action. Here, I’ll specify the Engine_Model, Model_Year and Campaign_Type columns in the the inputs parameter. Then, I’ll call the Frequency key after the action to obtain the SASDataFrame stored in the dictionary returned to the Python client. Remember, CAS actions always return a dictionary, or CASResults object, to the Python client. You must use familiar dictionary manipulation techniques to work with the results of an action. For more information on working with results of CAS actions, check out Part 2 – Working with CAS Actions and CASResults Objects.
## Columns to analyze colNames = ['Engine_Model', 'Model_Year', 'Campaign_Type'] ## Execute the freq CAS action and store the SASDataFrame freq_df = tbl.freq(inputs = colNames)['Frequency'] ## Display the type and DataFrame display(type(freq_df), freq_df) |

Again, the action processes the data in the distributed CAS server and returns results to the Python client. The results show the freq action counts the unique values of each column and stores the results in a single SASDataFrame. Once you have the SASDataFrame on the client, you can work with it like you would a Pandas DataFrame.
For example, I’ll loop over each analysis column, query the SASDataFrame for the specific column name, and then plot the count of unique values of each column using the familiar Pandas package.
for column in colNames: (freq_df .query('Column == @column') .loc[:,['CharVar','Frequency']] .set_index('CharVar') .sort_values(by = 'Frequency', ascending=False) .plot(kind='bar', figsize=(8,6), title = f'The {column} Column') ) |

The loop produces a visualization of the count of unique values for each analysis column. This was all done using familiar Pandas code on the client side. Remember, the distributed CAS server did all of the processing and summarization, then returned smaller summarized results to the Python client.
Using the freqTab CAS action
Lastly, you can use the freqTab.freqTab CAS action to construct frequency and crosstabulation tables. The freqTab action provides a variety of additional features and information. The action is not loaded by default, so I’ll begin by loading the action set.
conn.loadActionSet('freqTab') |

Then I’ll use the freqTab action in the freqTab action set to count the unique values for the Model_Year and Engine_Model columns, and also count the unique values of Engine_Model by Model_Year.
tbl.freqTab(tabulate = [ 'Model_Year', 'Engine_Model', {'vars':['Engine_Model','Model_Year']} ] ) |

The results above show the freqTab action returns a dictionary with a variety of information. The first SASDataFrame is level information, the second SASDataFrame shows the number of observations used, and the remaining SASDataFrames show the two one-way frequency tables for Model_Year, and Engine_Model, and the crosstabulation between Engine_Model by Model_Year (also includes the totals).
With the results on the Python client, you can begin accessing and manipulating the SASDataFrames as needed.
Summary
The SWAT package blends the world of Pandas and CAS. You can use many of the familiar Pandas methods within the SWAT package like value_counts, or the flexible, highly optimized CAS actions like simple.freq and freqTab.freqTab to obtain counts of unique values in the massively parallel processing CAS engine. For more examples on the freq or freqTab CAS actions, check out my CAS action four part series (part 1, part 2, part 3 and part 4). The four part series executes CAS actions using the native CAS language. However, with some small changes to the syntax you can execute the same actions using Python.
Additional and related resources
- Getting Started with Python Integration to SAS® Viya® – Index
- SWAT API Reference
- simple.freq CAS action
- freqTab.freqTab CAS action
- SAS® Cloud Analytic Services: Fundamentals
- CAS Action Documentation
- CAS Action! – a series on fundamentals
- SAS Course – SAS® Viya® and Python Integration Fundamentals
Getting started with Python integration to SAS® Viya® – Part 12 – Count of Unique Values was published on SAS Users.
| This post was kindly contributed by SAS Users - go there to comment and to read the full post. |