Has learning R been driving you a bit crazy? If so, it may be that you’re “lost in translation.” On April 21 and 23, I’ll be teaching a webinar, R for SAS, SPSS and Stata Users. With each R concept, … Continue reading →![]()
Tag: R
Analytics Software Popularity Update: Counting Blogs, Simplifying Job Searches
My latest update to The Popularity of Data Analysis Software is an attempt to use blog counts to estimate the popularity of analytics software. While I was able to greatly broaden the coverage of packages when studying job data, I … Continue reading →![]()
Type I error rates in test of normality by simulation
This simulation tests the type I error rates of the Shapiro-Wilk test of normality in R and SAS.
First, we run a simulation in R. Notice the simulation is vectorized: there are no “for” loops that clutter the code and slow the simulation.
# type I error
alpha <- 0.05

# number of simulations
n.simulations <- 10000

# number of observations in each simulation
n.obs <- 100

# a vector of test results
type.one.error     shapiro.test(rnorm(n.obs))$p.value)<alpha

# type I error for the whole simulation
mean(type.one.error)

# Store cumulative results in data frame for plotting
sim <- data.frame(
    n.simulations = 1:n.simulations,
    type.one.error.rate = cumsum(type.one.error) /
        seq_along(type.one.error))

# plot type I error as function of the number of simulations
plot(sim, xlab="number of simulations",
    ylab="cumulative type I error rate")

# a line for the true error rate
abline(h=alpha, col="red")

# alternative plot using ggplot2
require(ggplot2)
ggplot(sim, aes(x=n.simulations, y=type.one.error.rate)) +
    geom_line() +
    xlab('number of simulations') +
    ylab('cumulative type I error rate') +
    ggtitle('Simulation of type I error in Shapiro-Wilk test') +
    geom_abline(intercept = 0.05, slope=0, col='red') +
    theme_bw()

As the number of simulations increases, the type I error rate approaches alpha. Try it in R with any value of alpha and any number of observations per simulation.
It’s elegant the whole simulation can be condensed to 60 characters:
mean(replicate(10000,shapiro.test(rnorm(100))$p.value)<0.05)
Likewise, we now do a similar simulation of the Shapiro-Wilk test in SAS. Notice there are no macro loops: the simulation is simpler and faster using a BY statement.
data normal;
 length simulation 4 i 3; /* save space and time */
 do simulation = 1 to 10000;
  do i = 1 to 100;
   x = rand('normal');
   output;
  end;
 end;
run;

proc univariate data=normal noprint ;
 by simulation;
 var x;
 output out=univariate n=n mean=mean std=std NormalTest=NormalTest probn=probn;
run;

data univariate;
 set univariate;
 type_one_error = probnrun;

/* Summarize the type I error rates for this simulation */
proc freq data=univariate;
 table type_one_error/nocum;
run;
In my SAS simulation the type I error rate was 5.21%.
Tested with R 3.0.2 and SAS 9.3 on Windows 7.
For more posts like this, see Heuristic Andrew.
Job Trends in the Analytics Market: New, Improved, now Fortified with C, Java, MATLAB, Python, Julia and Many More!
I’m expanding the coverage of my article, The Popularity of Data Analysis Software. This is the first installment, which includes a new opening and a greatly expanded analysis of the analytics job market. Here it is, from the abstract onward … Continue reading →![]()
Learn R and/or Data Management from Home January or April
If you want to learn R, or improve your current R skills, join me for two workshops that I’m offering through Revolution Analytics in January and April. If you already know another analytics package, the workshop, Intro to R for … Continue reading →![]()
Use R in Hadoop by streaming
It seems that the combination of R and Hadoop is a must-have toolkit for people working with both statistics and large data set.
An aggregation example
The Hadoop version used here is Cloudera’s CDH4, and the underlying Linux OS is CentOS 6. The data used is a simulated sales data set form a training course by Udacity. Format of each line of the data set is: date, time, store name, item description, cost and method of payment. The six fields are separated by tab. Only two fields, store and cost, are used to aggregate the cost by each store.
A typical MapReduce job contains two R scripts: Mapper.R and reducer.R.
Mapper.R
# Use batch mode under R (don't use the path like /usr/bin/R)
#! /usr/bin/env Rscript

options(warn=-1)

# We need to input tab-separated file and output tab-separated file

input = file("stdin", "r")
while(length(currentLine = readLines(input, n=1, warn=FALSE)) > 0) {
   fields = unlist(strsplit(currentLine, "\t"))
   # Make sure the line has six fields
   if (length(fields)==6) {
       cat(fields[3], fields[5], "\n", sep="\t")
   }
}
close(input)
Reducer.R
#! /usr/bin/env Rscript

options(warn=-1)
salesTotal = 0
oldKey = ""

# Loop around the data by the formats such as key-val pair
input = file("stdin", "r")
while(length(currentLine = readLines(input, n=1, warn=FALSE)) > 0) {
  data_mapped = unlist(strsplit(currentLine, "\t"))
  if (length(data_mapped) != 2) {
    # Something has gone wrong. However, we can do nothing.
    continue
  }

  thisKey = data_mapped[1]
  thisSale = as.double(data_mapped[2])

  if (!identical(oldKey, "") && !identical(oldKey, thisKey)) {
    cat(oldKey, salesTotal, "\n", sep="\t")
    oldKey = thisKey
    salesTotal = 0
  }

  oldKey = thisKey
  salesTotal = salesTotal + thisSale
}

if (!identical(oldKey, "")) {
  cat(oldKey, salesTotal, "\n", sep="\t")
}

close(input)
Testing
Before running MapReduce, it is better to test the codes by some linux commands.
# Make R scripts executable
chmod w+x mapper.R
chmod w+x reducer.R
ls -l

# Strip out a small file to test
head -500 purchases.txt > test1.txt
cat test1.txt | ./mapper.R | sort | ./reducer.R
Execution
One way is to specify all the paths and therefore start the expected MapReduce job.
hadoop jar /usr/lib/hadoop-0.20-mapreduce/contrib/streaming/hadoop-streaming-2.0.0-mr1-cdh4.1.1.jar
-mapper mapper.R –reducer reducer.R
–file mapper.R –file reducer.R
-input myinput
-output joboutput
Or we can use the alias under CDH4, which saves a lot of typing.
hs mapper.R reducer.R myinput joboutput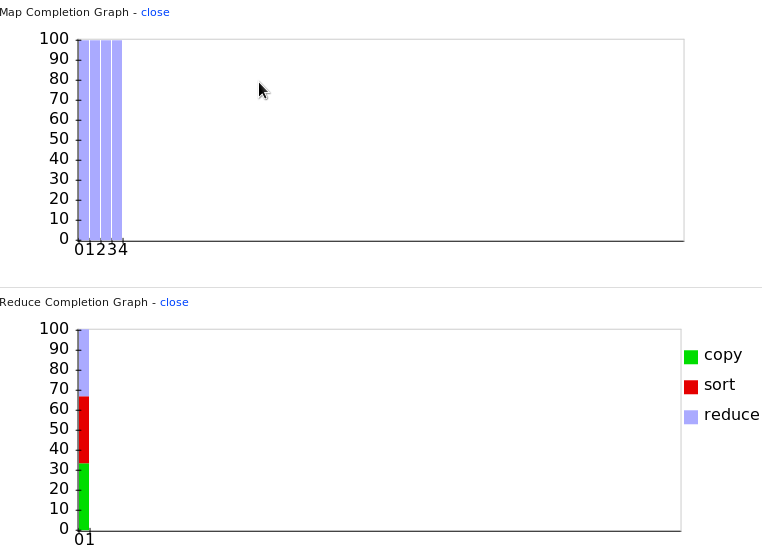
Overall, the MapReduce job driven by R is performed smoothly. The Hadoop JobTracker can be used to monitor or diagnose the overall process.
Rhadoop or streaming?
RHadoop is a package developed under Revolution Alytics, which allows the users to apply MapReduce job directly in R and is surely a much more popular way to integrate R and Hadoop. However, this package currently undergoes fast evolution and requires complicated dependency. As an alternative, the functionality of streaming is embedded with Hadoop, and supports all programming languages including R. If the proper installation of RHadoop poses a challenge, then streaming is a good starting point.
The Hardware and Software 2013 I’m Most Thankful For
It’s time of year to give thanks. As a programmer, e-book reader, blog writer and web surfer, I should express my sincere appreciation to such hardware and software (I use majority of them at daily basis and most of them are free): 0. Hardware Lenovo Thinkpad W520 (This is not free): my workhorse machine, now replaced […]
What R Has Been Missing
While R has more methods than any other analytics software, it has been missing a crucial feature found in most other packages. SPSS Modeler had it first, way back when they still called it Clementine. Then SAS Institute realized how crucial … Continue reading →![]()